Spectra Calculation
Overview
MOMAP is able to simulate absorption, fluorescence and phosphorescence
spectra and calculate the corresponding radiative decay rate constant,
which is based on TVCORF_SPEC [1] and TVSPEC_SPEC
subprograms. TVCORF_SPEC subprogram is used to calculate thermal
vibration correlation function (TVCF). TVSPEC_SPEC subprogram is
used to simulate fluorescence spectrum.
In the following part, this kind of calculation will be called rad_FL calculation.
Start running calculation
To start a rad_FL calculation, you need a evc.cart.dat file or a
evc.dint.dat file, a job control file and a parallel control file.
evc.*.dat file is obtained from the previous evc calculation. Job
control file is used to generate an input for TVCORF_SPEC and
TVSPEC_SPEC subprograms, as well as implement parallel computation.
Parallel control file is used to control computation nodes.
There is an example of performing rad_FL calculation on
1,4-distyrylbenzene, which is often called DSB. The input files can be
found in examples/DSB/spec. 4 files are required in this example.
evc.cart.datevc calculation result.jobGenerate input file and implement parallel computation. Computation parameters are involved in this file.runSet file path for job file and nodefile and run the calculation.examples/config/nodefileControl computation nodes. The file path should be designated in run file. Other examples can be found inexamples/6T/specandexamples/porphyrin/spec.
Modifying job file
Here is an example of job file. Control parameters and their functions are listed down below. Change the parameters before performing a rad_FL calculation.
&control
  DUSHIN       = .t.             # Toggle Duschinsky rotation effect
  HERZ         = .f.             # Toggle Herzberg-Teller effect
  Temp         = 298 K           # Temperature
  tmax         = 300 fs          # Integral interval of correlation function (Must be converged. See section 4.4)
  dt           = 0.01 fs         # Integration step of correlation function (As small as possible)
  Ead          = 0.11069521 au   # Adiabatic energy difference between two states (Able to change unit)
  EDMA         = 1 debye         # Electric dipole moment of absorption (Ground state)
  EDME         = 1 debye         # Electric dipole moment of emission (Excited state)
  FreqScale    = 1.0             # Frequency Scaling factor
  logFile      = "log"           # Name of output info file (output)
  DSFile       = "evc.cart.dat"  # Name of evc file (input)
  FtFile       = "ft.dat"        # Name of correlation function info file (output)
  isgauss      = .f.             # Toggle spectrum broadening
  BroadenType  = "lorentzian"    # Type of broadening function (lorentz / gauss)
  Broadenfunc  = "frequency"     # Type of broadening parameter (freq / time)
  FWHM         = 100 cm-1        # Broadening width (FWHM)
  GFile        = "gsfile"        # Name of broadening info file (output)
  NScale       = 1
  Emin         = -0.3 au         # Lower bound of spectrum
  Emax         = 0.3 au          # Upper bound of spectrum
  dE           = 0.00001 au      # Integration step of spectrum
  FoFile       = "fo.dat"        # Name of spectrum info (output)
  FoSFile      = "spec.dat"      # Name of spectrum info (output)
/
If you want to consider Herzberg-Teller effect in your calculation,
please refer to examples/porphyrin for more information.
If you want to use sum-over-states approach to calculate spectrum at
absolute zero (0 K), please refer to examples/DSB/spectra0 for more
information.
Verify convergence of correlation function and obtain results
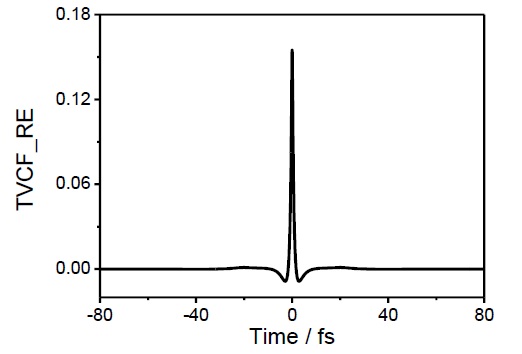
Correlation function must be converged before obtaining any calculation results. To verify, plot a graph using first 2 columns in ft.dat, which are time and real part of the correlation function (TVCF_RE). TVCF_RE should be very close to zero and stop oscillating before it reaches the integration time limit. Plot of time and real part of a converged correlation function shows a graph of a converged correlation function.
Radiative decay rate constant can be found at the end of log file.
Fluorescence spectrum information can be obtained from spec.dat.

Plot of time and real part of a converged correlation function
| [1] | TVCORF_SPEC_para subprogram is available for parallel
computation. |